Arduino-Nano Valve Analyser
This page is out of date. See my updated analyser here.
 After building my minimalist valve tester and curve tracer I decided to go drag myself into the 21st century by building something a little more sophisticated.
I was inspired by the u-Tracer and by John Polstra's analyser project.
John was kind enough to share his circuits with me which I was able to plagiarise and turn into my own low-cost, computerised valve analyser.
Mine works in pretty much the same way as his, but I used two Arduino Nanos instead of the PIC processors he used.
The nice thing about all these analysers is that they apply very short voltage pulses to the device under test (DUT), meaning you can trace curves up to high voltage and current without continuous power dissipation that might damage the DUT.
It also dramatically cuts costs since you don't need a big power transformer to run everything.
My analyser will go up to 500V at 500mA, yet needs only a 10VA 230V isolation transformer.
The heater is supplied from a cheap 24V AC-DC switching power supply module -that's all the power the project needs.
After building my minimalist valve tester and curve tracer I decided to go drag myself into the 21st century by building something a little more sophisticated.
I was inspired by the u-Tracer and by John Polstra's analyser project.
John was kind enough to share his circuits with me which I was able to plagiarise and turn into my own low-cost, computerised valve analyser.
Mine works in pretty much the same way as his, but I used two Arduino Nanos instead of the PIC processors he used.
The nice thing about all these analysers is that they apply very short voltage pulses to the device under test (DUT), meaning you can trace curves up to high voltage and current without continuous power dissipation that might damage the DUT.
It also dramatically cuts costs since you don't need a big power transformer to run everything.
My analyser will go up to 500V at 500mA, yet needs only a 10VA 230V isolation transformer.
The heater is supplied from a cheap 24V AC-DC switching power supply module -that's all the power the project needs.
Overview:
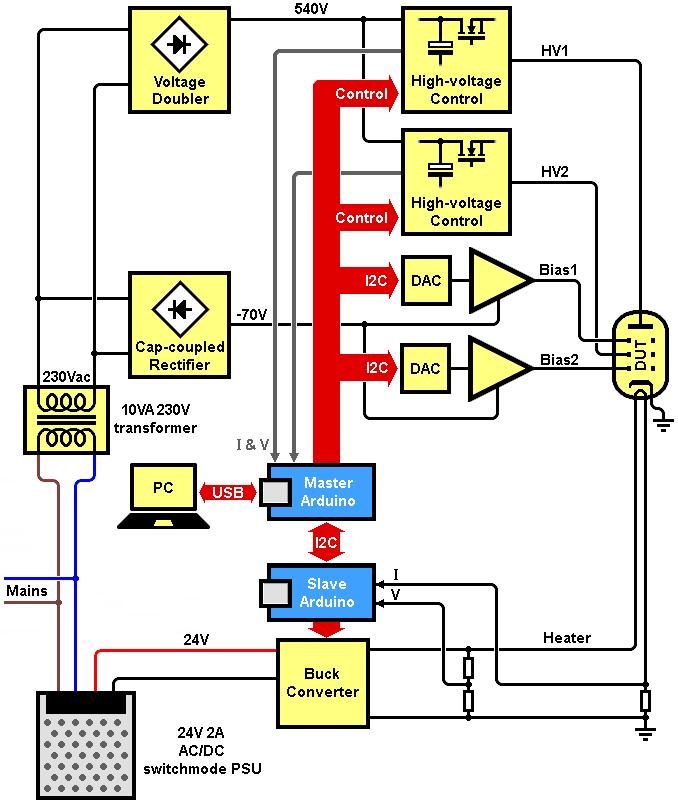
The block diagram on the right shows the basic parts of the Valve Analyser.
Starting at the bottom, a single PWM buck regulator is controlled by one Arduino Nano.
This takes the 24V from the switching power supply and reduces it to whatever is needed by the DUT, e.g. 6.3V or whatever, up to 2 amps.
This Arduino (which I call the slave Arduino) continously measures the heater voltage and heater current with its built in ADC, and reports the results back to the master Arduino.
Directly-heated triodes can be tested.
The master Arduino controls a pair of digital-to-analog converters (DACs) which produce DC voltages that are amplified and inverted to produce two negative voltages up to -60V which provide bias to the DUT.
These two identical bias supplies can supply the two grids of a twin triode, or even be used to test pentodes with negative suppressor grid as shown here.
The master Arduino also controls two identical high-voltage supplies that can deliver up to 500V pulses to the DUT.
The operation of these blocks is explained in more detail below.
The Arduino measures these applied voltages and the resulting current through the DUT, and reports back to the PC.
Curves can then be plotted using this data.
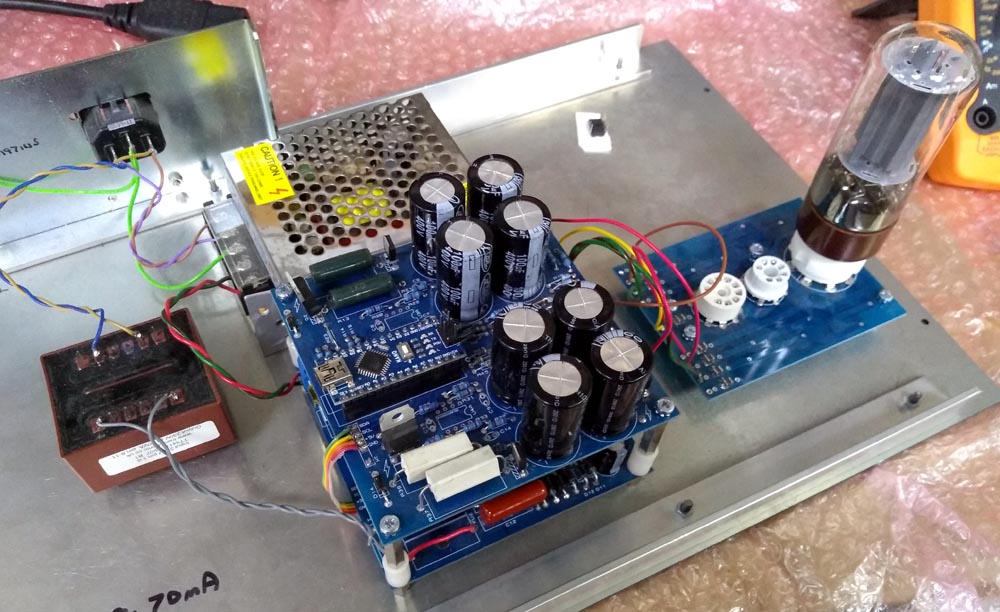
I built my prototype on two stacked PCBs.
It's a bigger circuit than usual for my website, so I've had to present it in the original design files.
Click to enlarge.
Heater Supply:
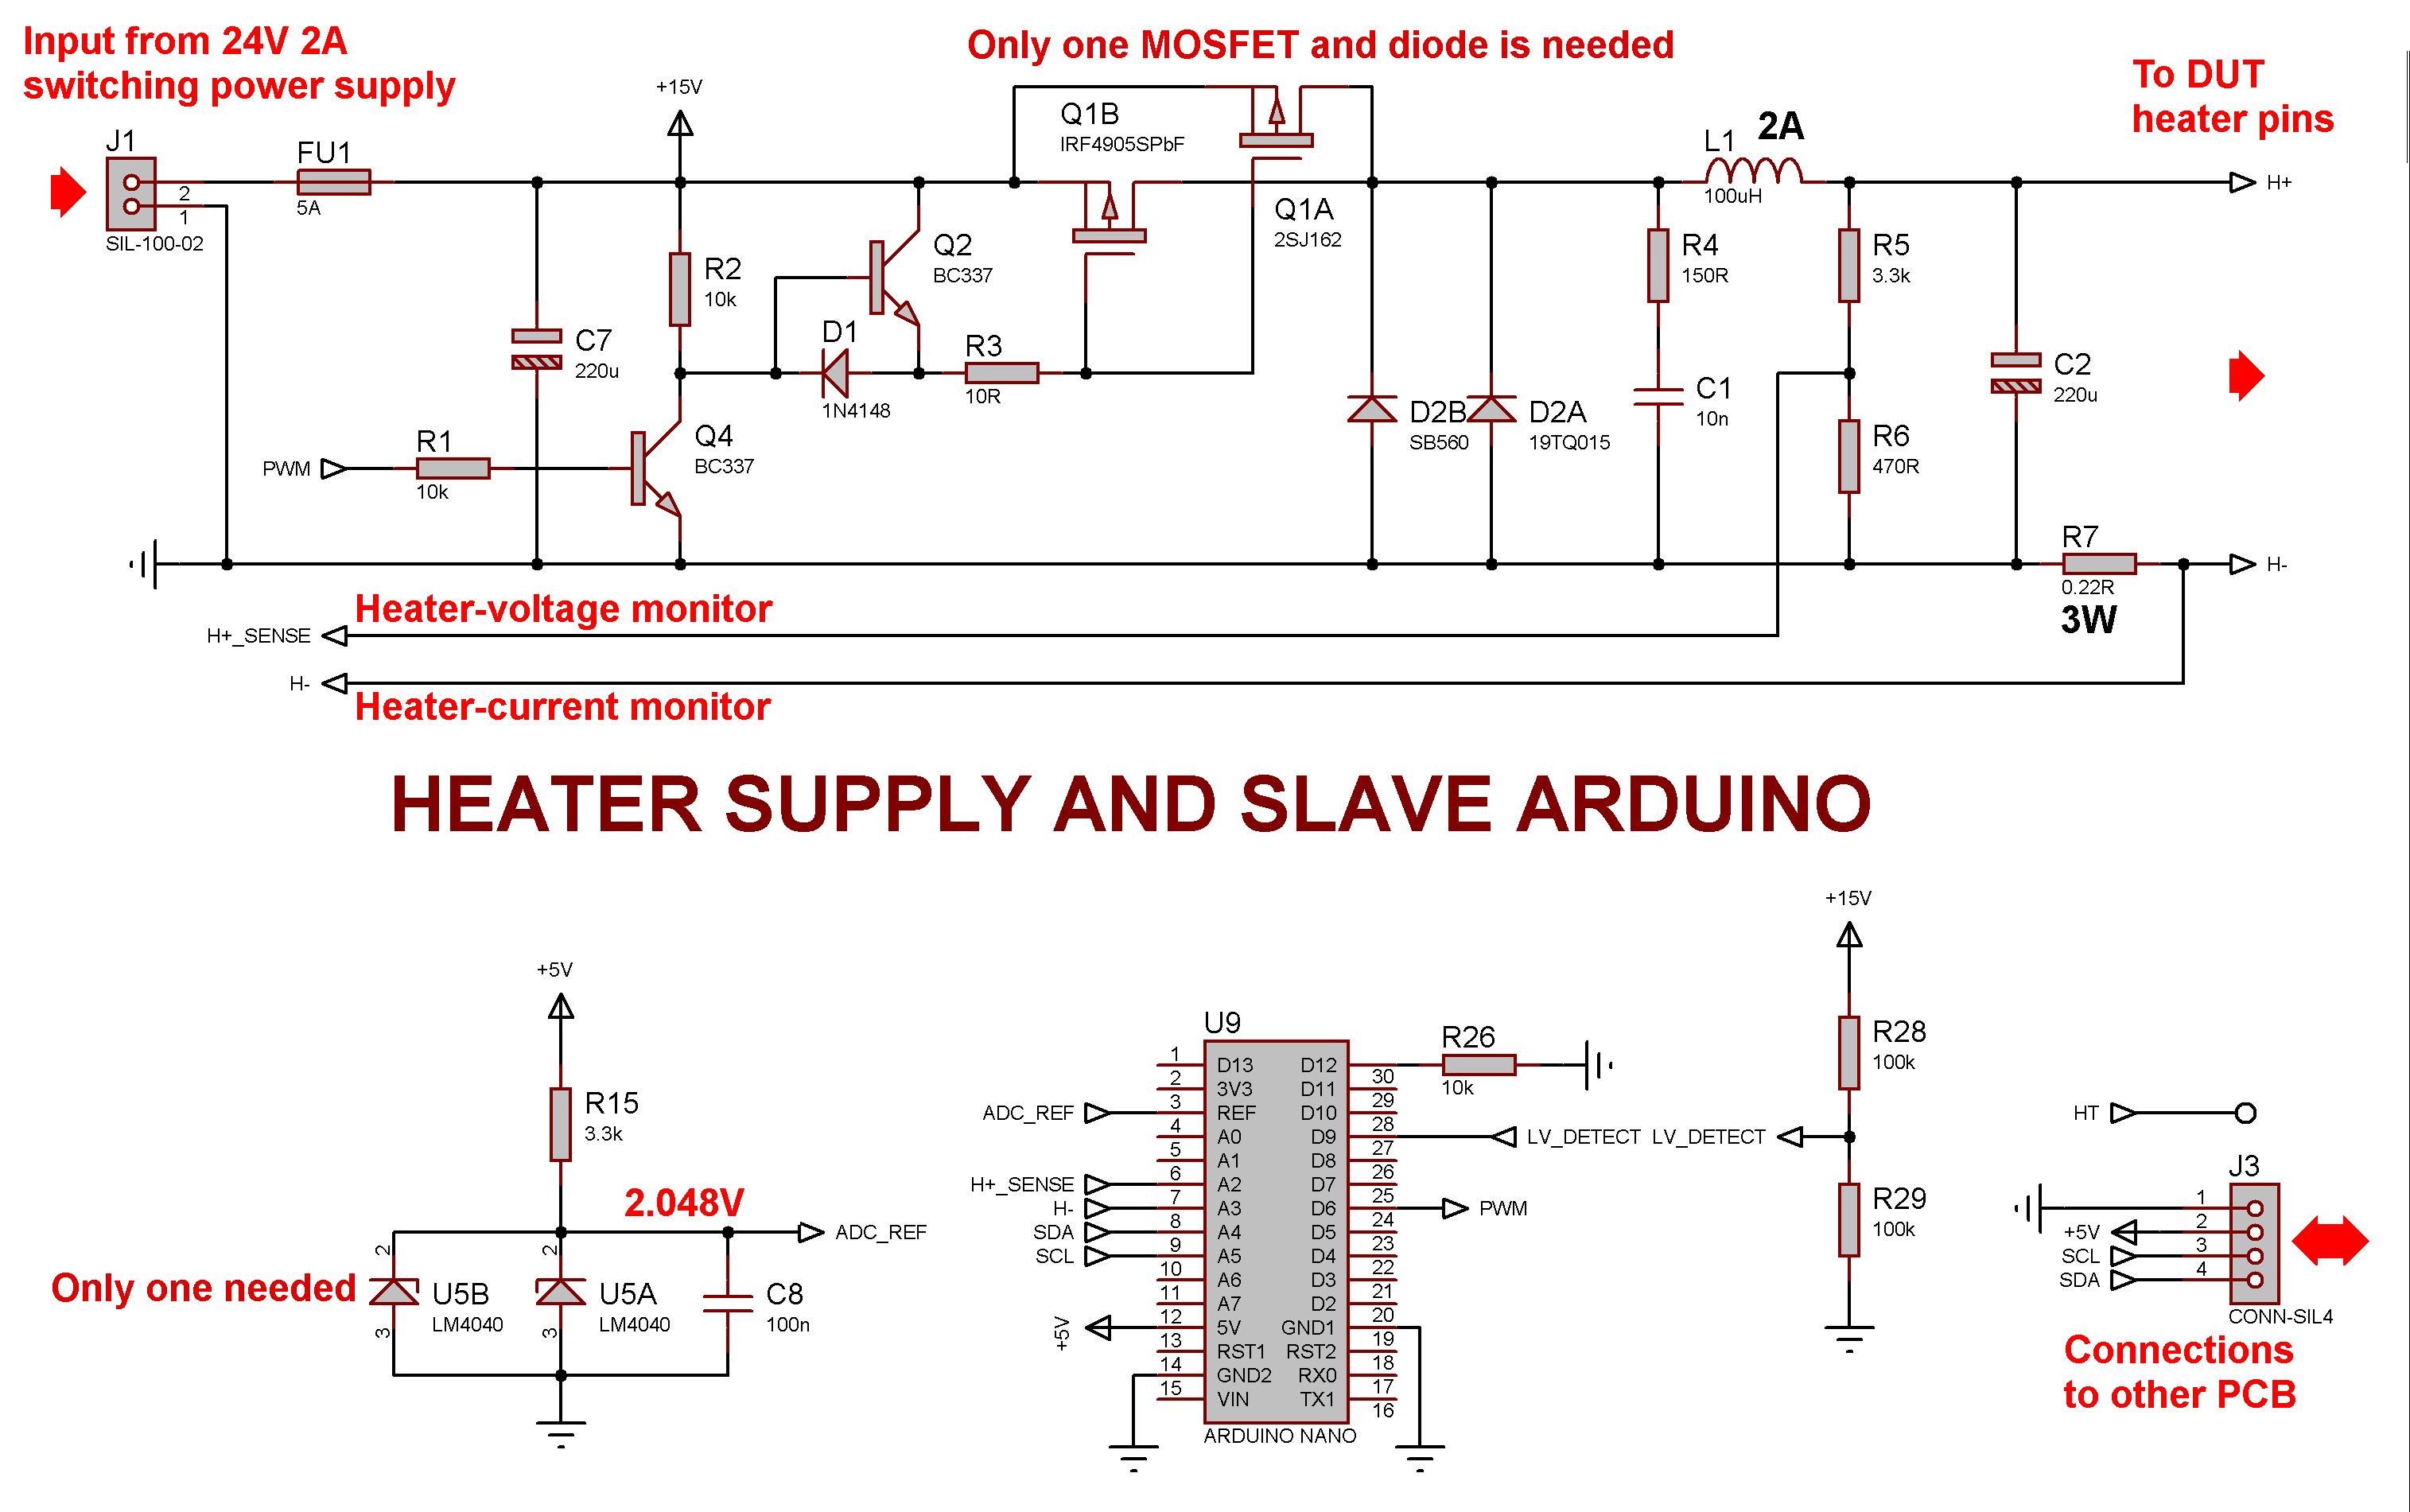
The heater supply consists of a simple buck regulator which is controlled by the slave Arduino U9.
24V from a cheap switching power supply comes in via connector J1 and, after being converted to the required voltage, is sent to the valve heater pins.
I won't explain exactly how a buck regulator works since there are lots of online sources for that.
Suffice it to say that a power MOSFET is switched on and off with PWM.
The schematic shows two MOSFETs (Q1A & Q1B) because I wanted the option of using one or the other depending on what I had (one was surface mount, the other TO-220).
Two Schottky diodes D2A & D2B, and two voltage references U5A & U5B are shown for the same reason.
Only one of each is actually needed.
The 100uH indutor should be rated for at least 2 amps.
The slave Arduino recieves an instruction from the master Arduino via I2C, telling it what heater voltage has been requested by the user.
The slave Arduino checks that 24V is present (from the potential divider R5-R6) and increments the PWM control to Q4 which drives the MOSFET.
The heater voltage is monitored via potential divider R5-R6.
The Arduino ramps up the heater voltage to the required value while simultaneously monitoring the voltage across the 0.22R resistor R7.
This is how it measures the heater current, and it clamps the voltage if the current exceeds 2 amps.
This provides a soft-start to the heater and protection for the power supply.
Before you ask, yes it subtracts this voltage from the voltage measured on the 'high side' of the heater, so it regulates the true voltage across the heater itself.
The reason for first checking the 24V is present is because the Arduino would otherwise ramp up the PWM to the max value even if the supply was switched off, causing the 24V supply to go into into automatic shutdown when trying to switch on into a cold heater.
Both Arduinos are programmed with the same code, and each one checks the state of pin-D12 at startup.
It is pulled low by R26 so this Arduino knows it is running in slave mode.
The bias supplies are on the same PCB but the slave Arduino has nothing to do with them.
Bias Supplies:

There are two identical bias supplies.
This allows dual-triodes to be tested simultaneously, or to do interesting tests with pentodes like making the suppressor grid negative.
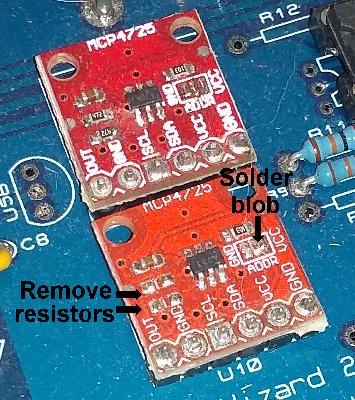 The master Arduino sends the required bias voltages in the form of 12-bit instructions to a pair of MCP4725 DACs.
These DACs are available very cheaply online as pre-built PCBs.
You need to mod one of them so the Arduino can address each DAC individually; this is done by adding a solder blob from the ADDR pad to the VCC pad on the little PCB.
Also remove two of the pull-up resistors.
The master Arduino sends the required bias voltages in the form of 12-bit instructions to a pair of MCP4725 DACs.
These DACs are available very cheaply online as pre-built PCBs.
You need to mod one of them so the Arduino can address each DAC individually; this is done by adding a solder blob from the ADDR pad to the VCC pad on the little PCB.
Also remove two of the pull-up resistors.
Each DAC can only produce a positive analog voltage up to its supply voltage, which is 4.095V set by reference IC U5.
But we need a large negative bias voltage.
The positive voltage produced by each DAC is therefore inverted and amplified by a factor of -16.5 by a OPA454 high-voltage opamp, making a little over -60V available in fine 16.5mV increments!
The opamps run off asymmetrical power rails, +5V and -70V (actually -66V); this is because we don't need them to swing their outputs above 0V.
The opamps are rated for 100V supply and are one of the few 'specialist' parts in the project, costing about 5 each.
The LTC6090 should also work as an alternative.
Two pairs are shown on the schematic because one pair is SMD and the other is through-hole, so I had the option.
The gain-setting resistors (R8-11, R18/20/21/24) are used in parallel combinations to improve the precision, because by using two 1% resistors in parallel you effectively get 0.7% tolerance.
Build-out resistors R14 & R22 and diodes D4 & D5 protect the opamp outputs from possible shorts inside the DUT that might try to dump high voltage into them.
They also stop the opamps from driving the DUT grids positive during a fault.
This IC has an enable-disable function which is not needed here, so pin-8 is pulled up and pin-1 is pulled to ground.
Note that C3, C5 and C9 need to be rated for at least 100V, this is no ordinary opamp.
High Voltage Rectifiers
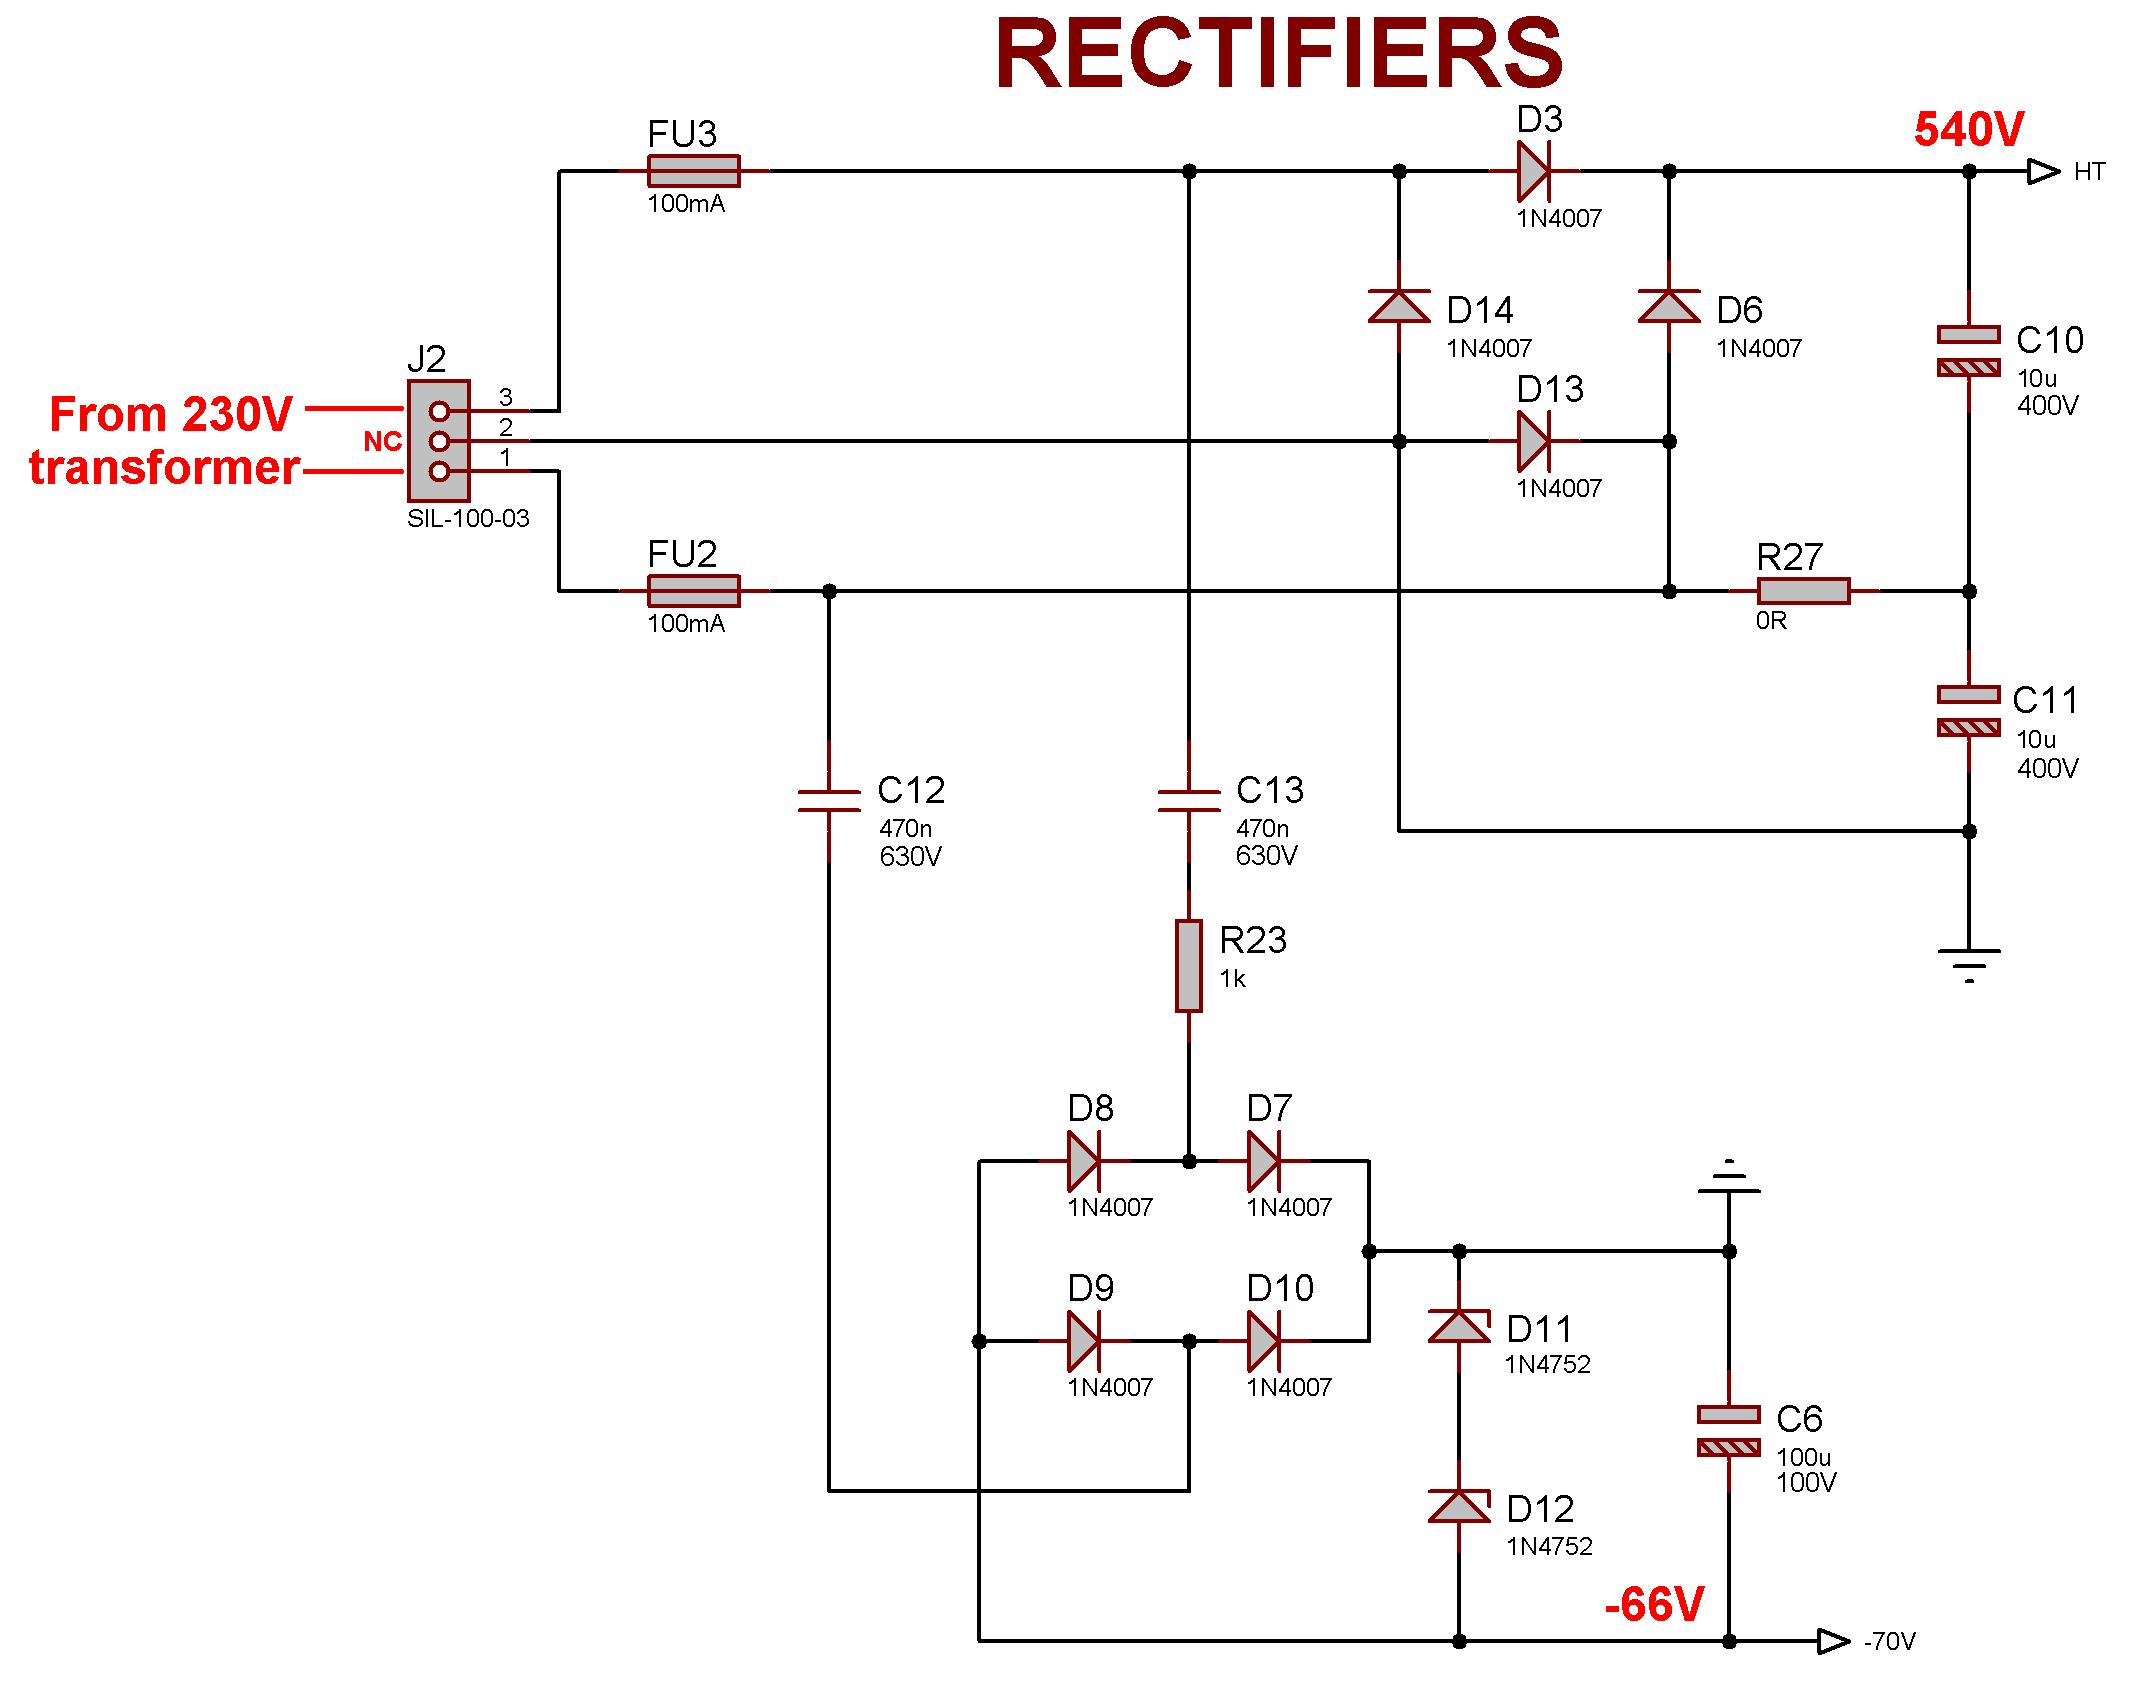
The final section of this PCB contains the rectifiers that produce the raw HT and bias voltages.
I ended up using a single-winding, 10VA 230V isolation transformer; you can find these in bathroom shaver sockets!
Mine actually delivers about 200Vac, which is fine, and I presume a pair of back-to-back transformers would work just as well.
I also gave myself the option of using a centre-tapped transformer which is why the schematic contains more diodes than necessary.
After passing through fuses, the 200Vac is voltage doubled to produce about 540Vdc across C10/11.
Since the voltage is shared these capacitors can be 400V rated.
To allow for a practical charging time, the maximum test voltage is defined as 500V.
In addition to this, the 200Vac supply is capacitor-coupled by C12/13 to a bridge rectifier which produces the negative voltage for the bias supplies.
This rail is clamped to -66V with a pair of 33V Zener diodes, to prevent damage to the high-voltage opamps.
R23 and the coupling capacitors limit the available current to a few milliamps, which is a sort of built-in safety feature.
Master Arduino and Storage Capacitors
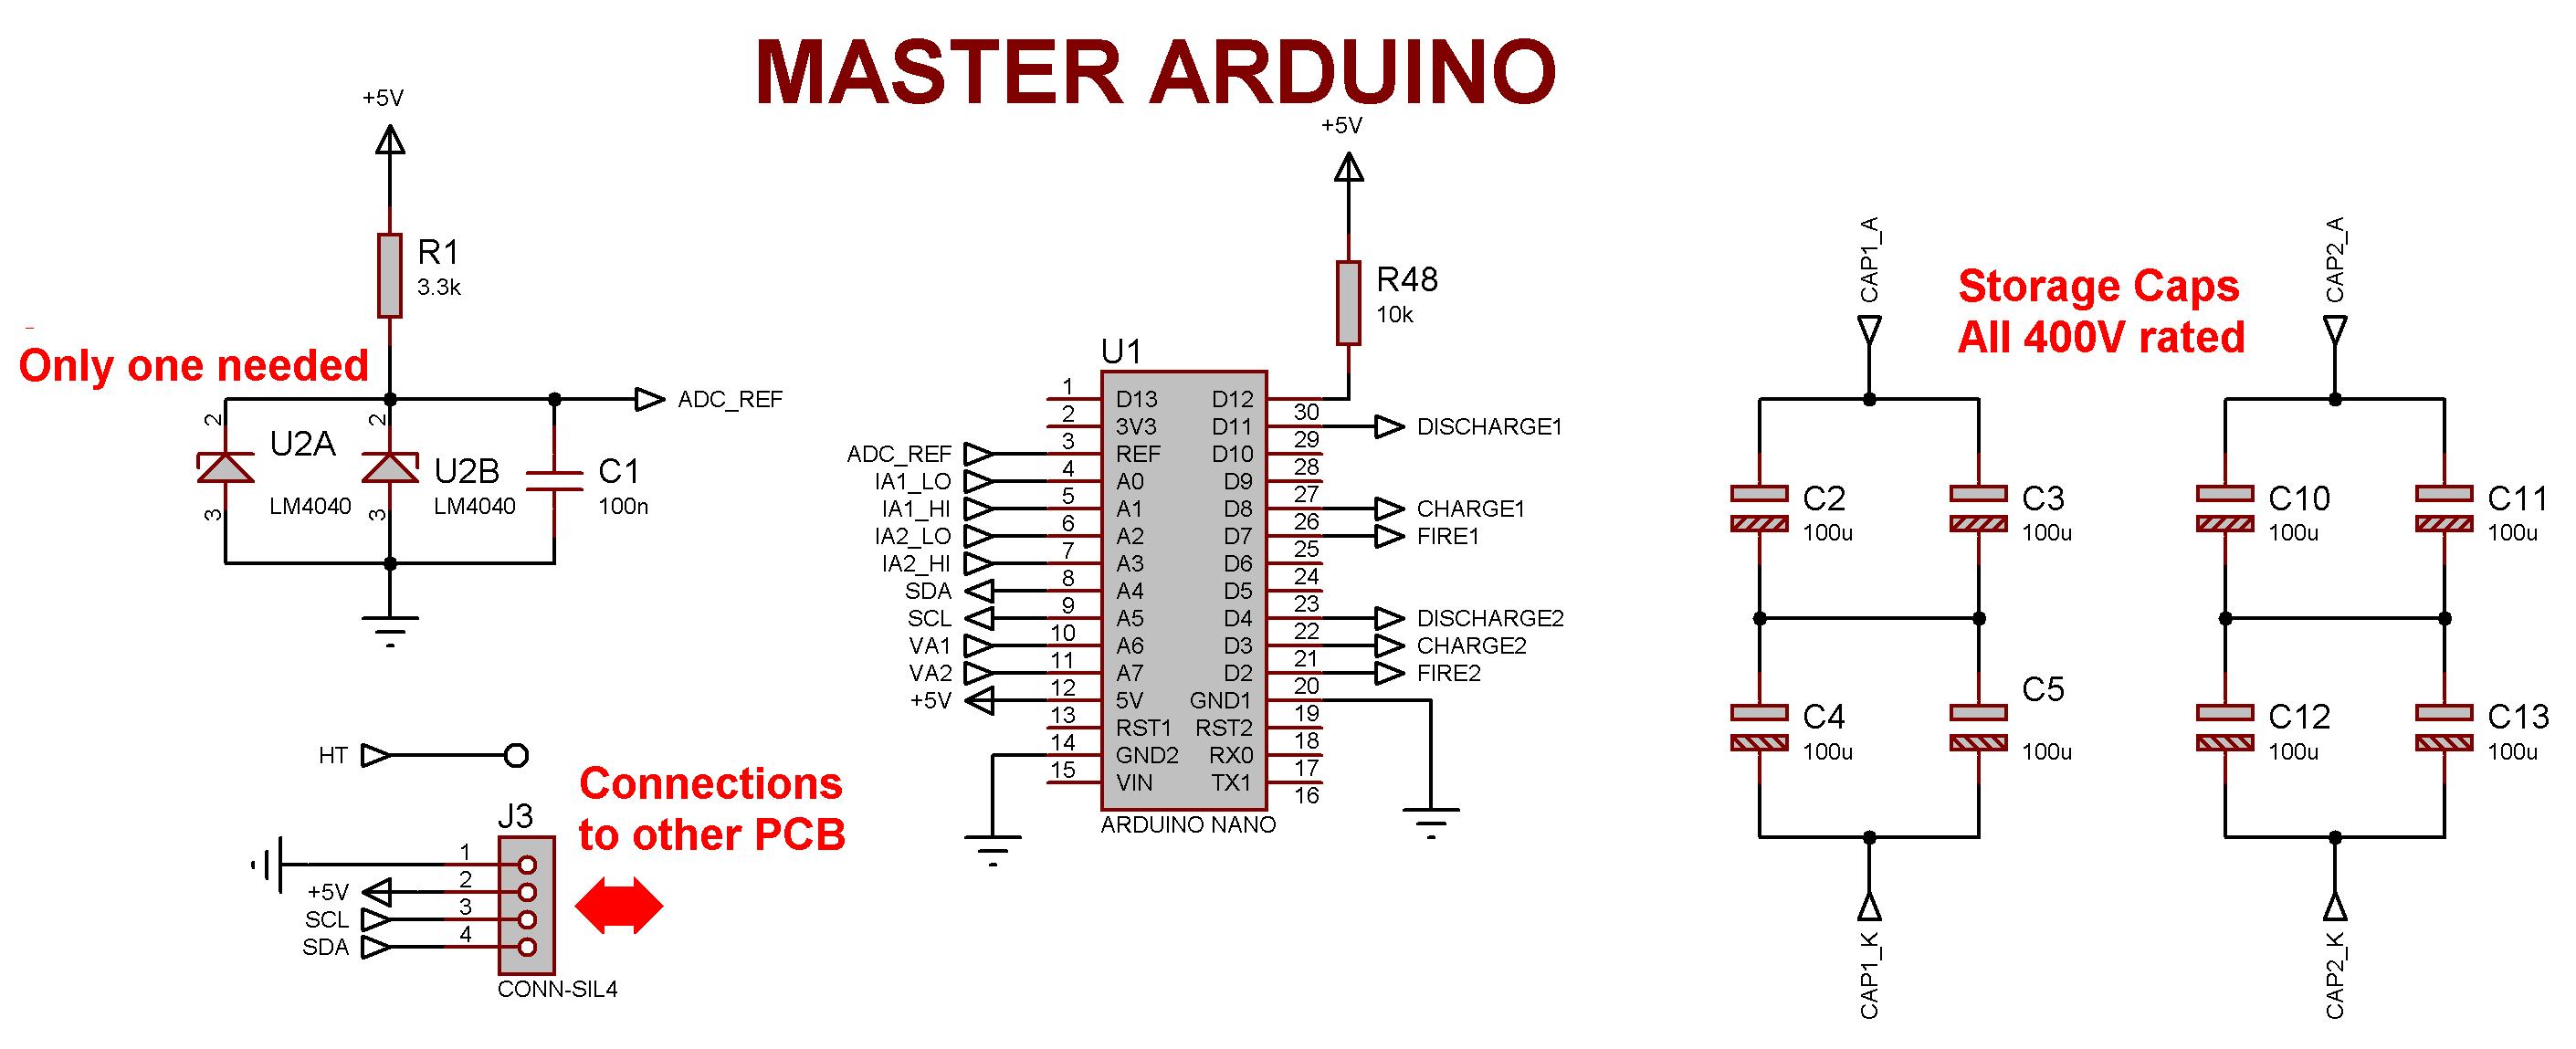
Moving on to the second PCB, this schematic shows the master Arduino and HT storage capacitors C2-5 and C10-13.
These two capacitor banks are where the energy is stored before being quickly applied to the DUT.
The capacitors are arranged in series/parallel so the voltage is shared, meaning 350V-rated (or more) capacitors can be used.
If you know your capacitor maths you will see that each bank represents 100uF total storage.
It takes much less than a millisecond to apply the voltage to the DUT, so if the DUT takes the full rated 500mA then the applied voltage will sag by less than V = It/C = 500mA*1ms/100uF = 5V.
This doesn't actually affect the accuracy of the results because the Arduino records the true voltage at the same time as recording the current.
High Voltage Supplies
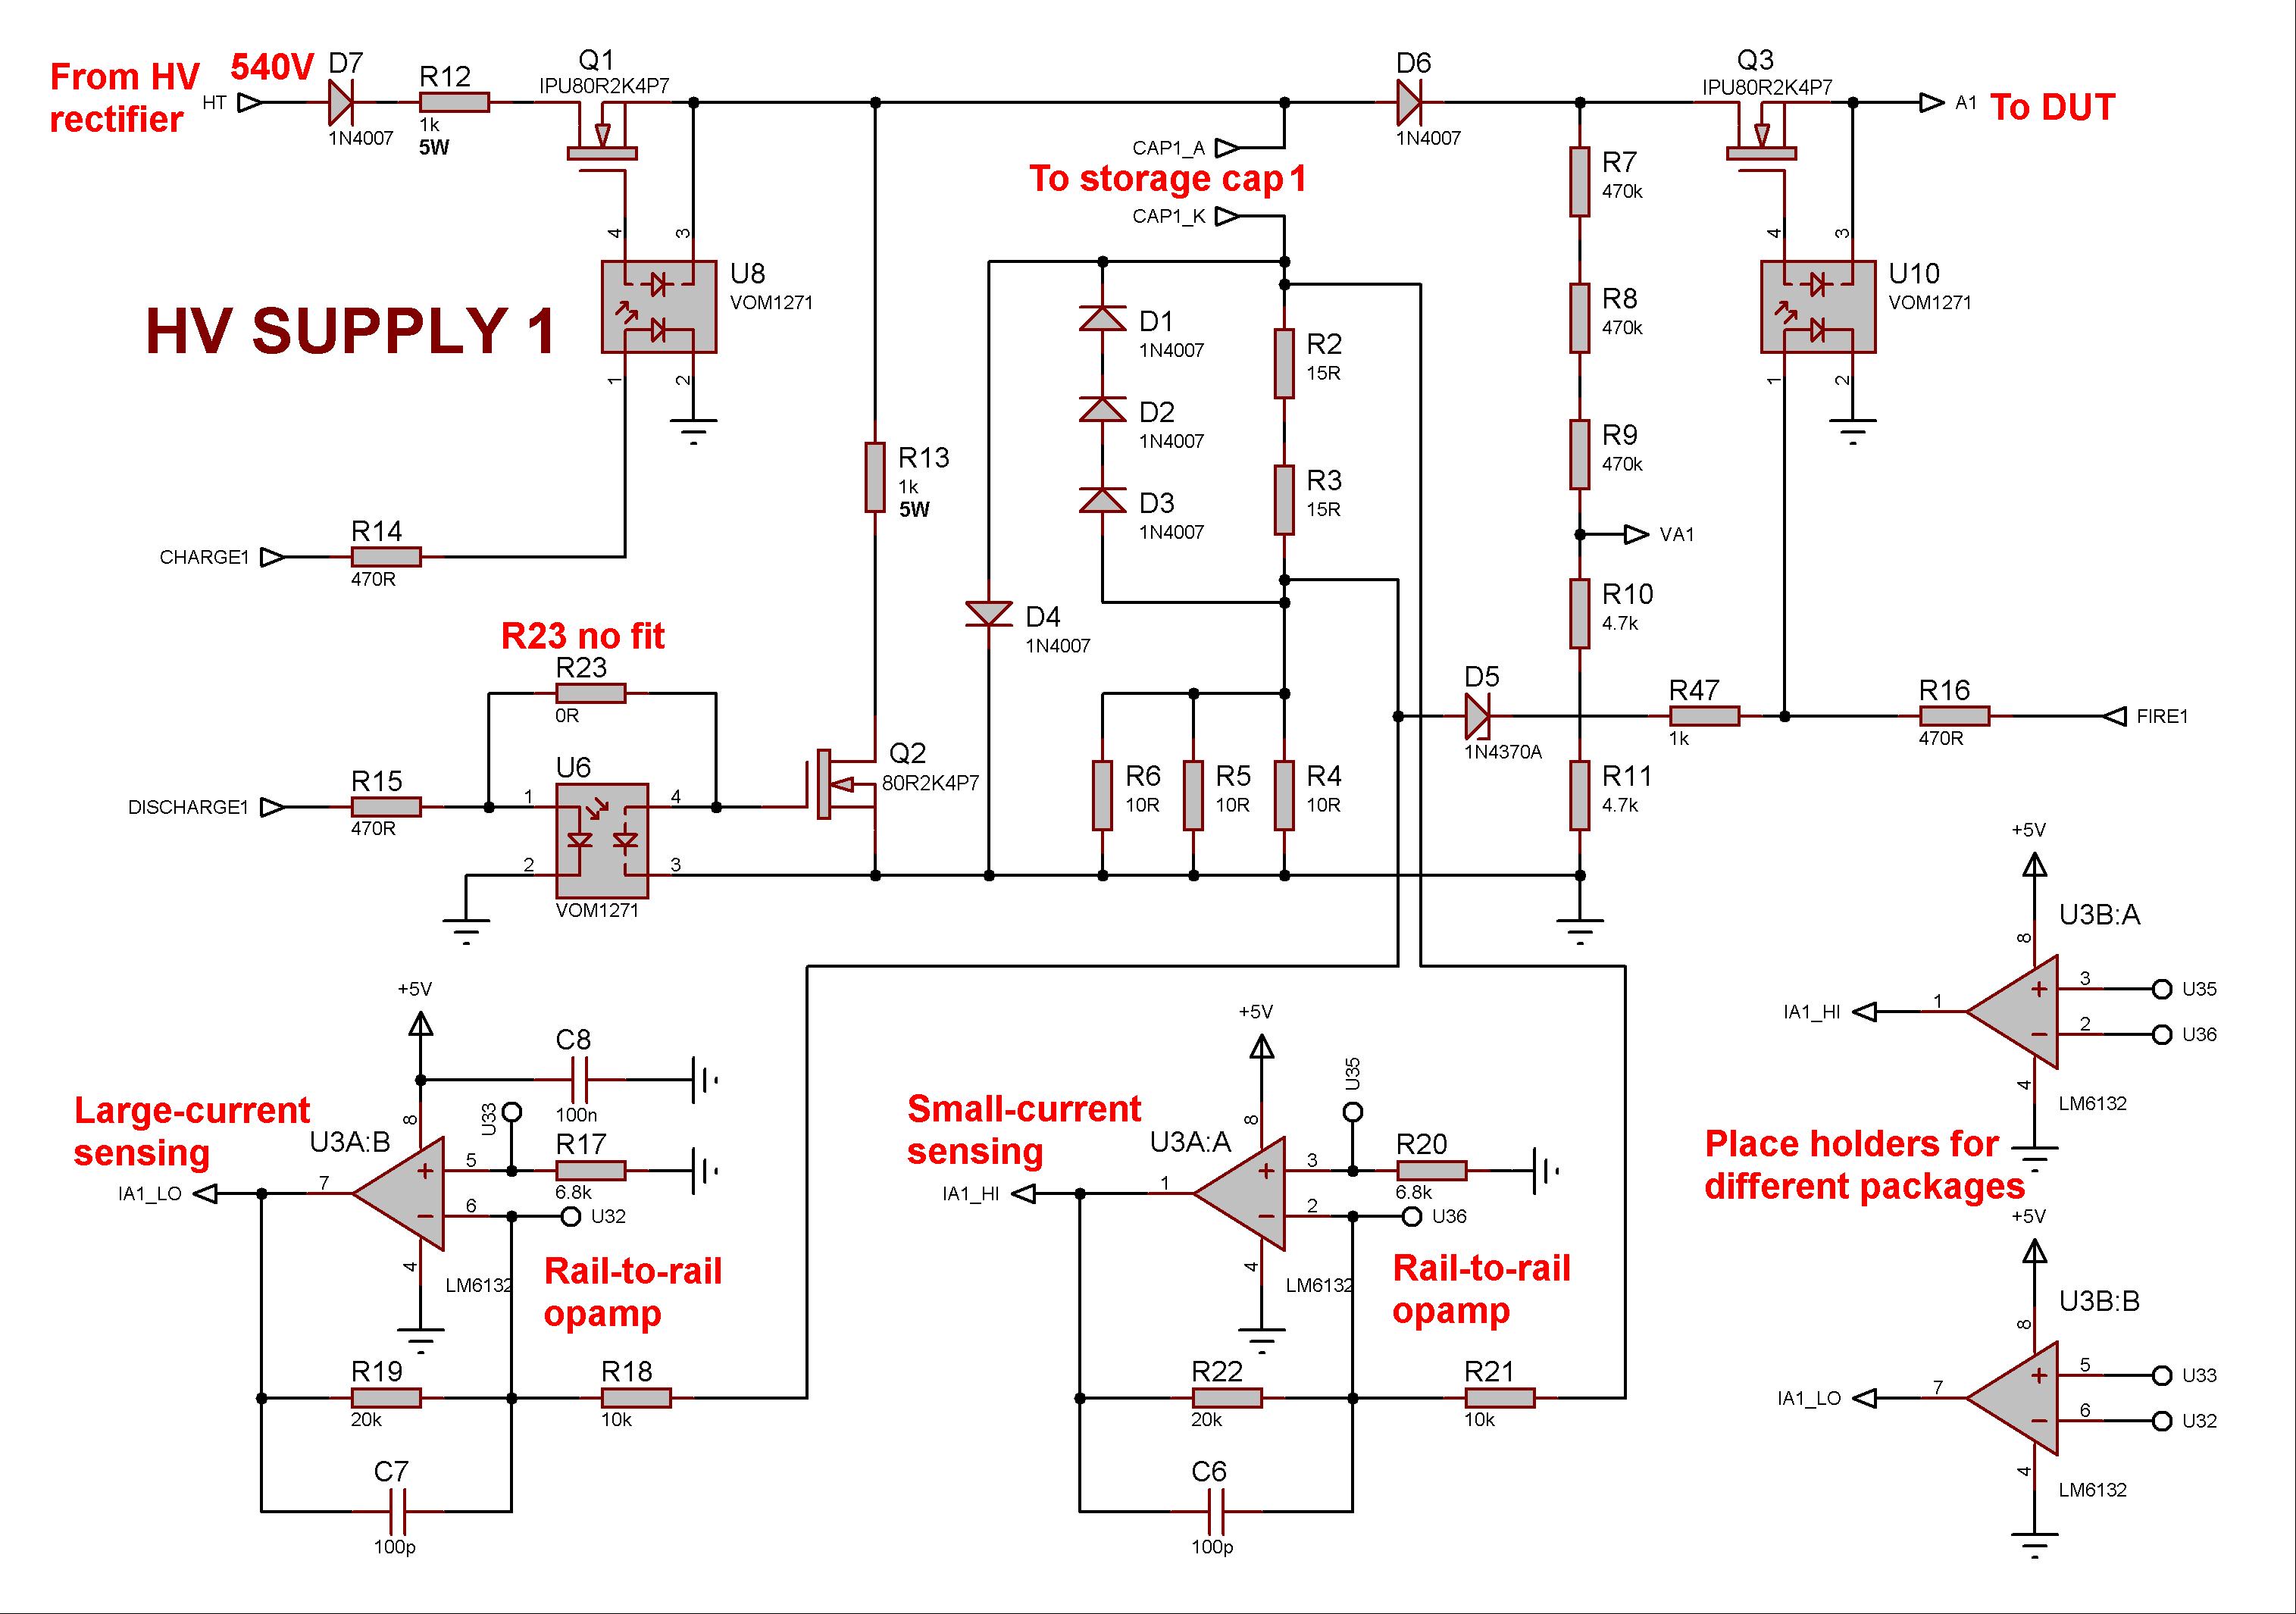
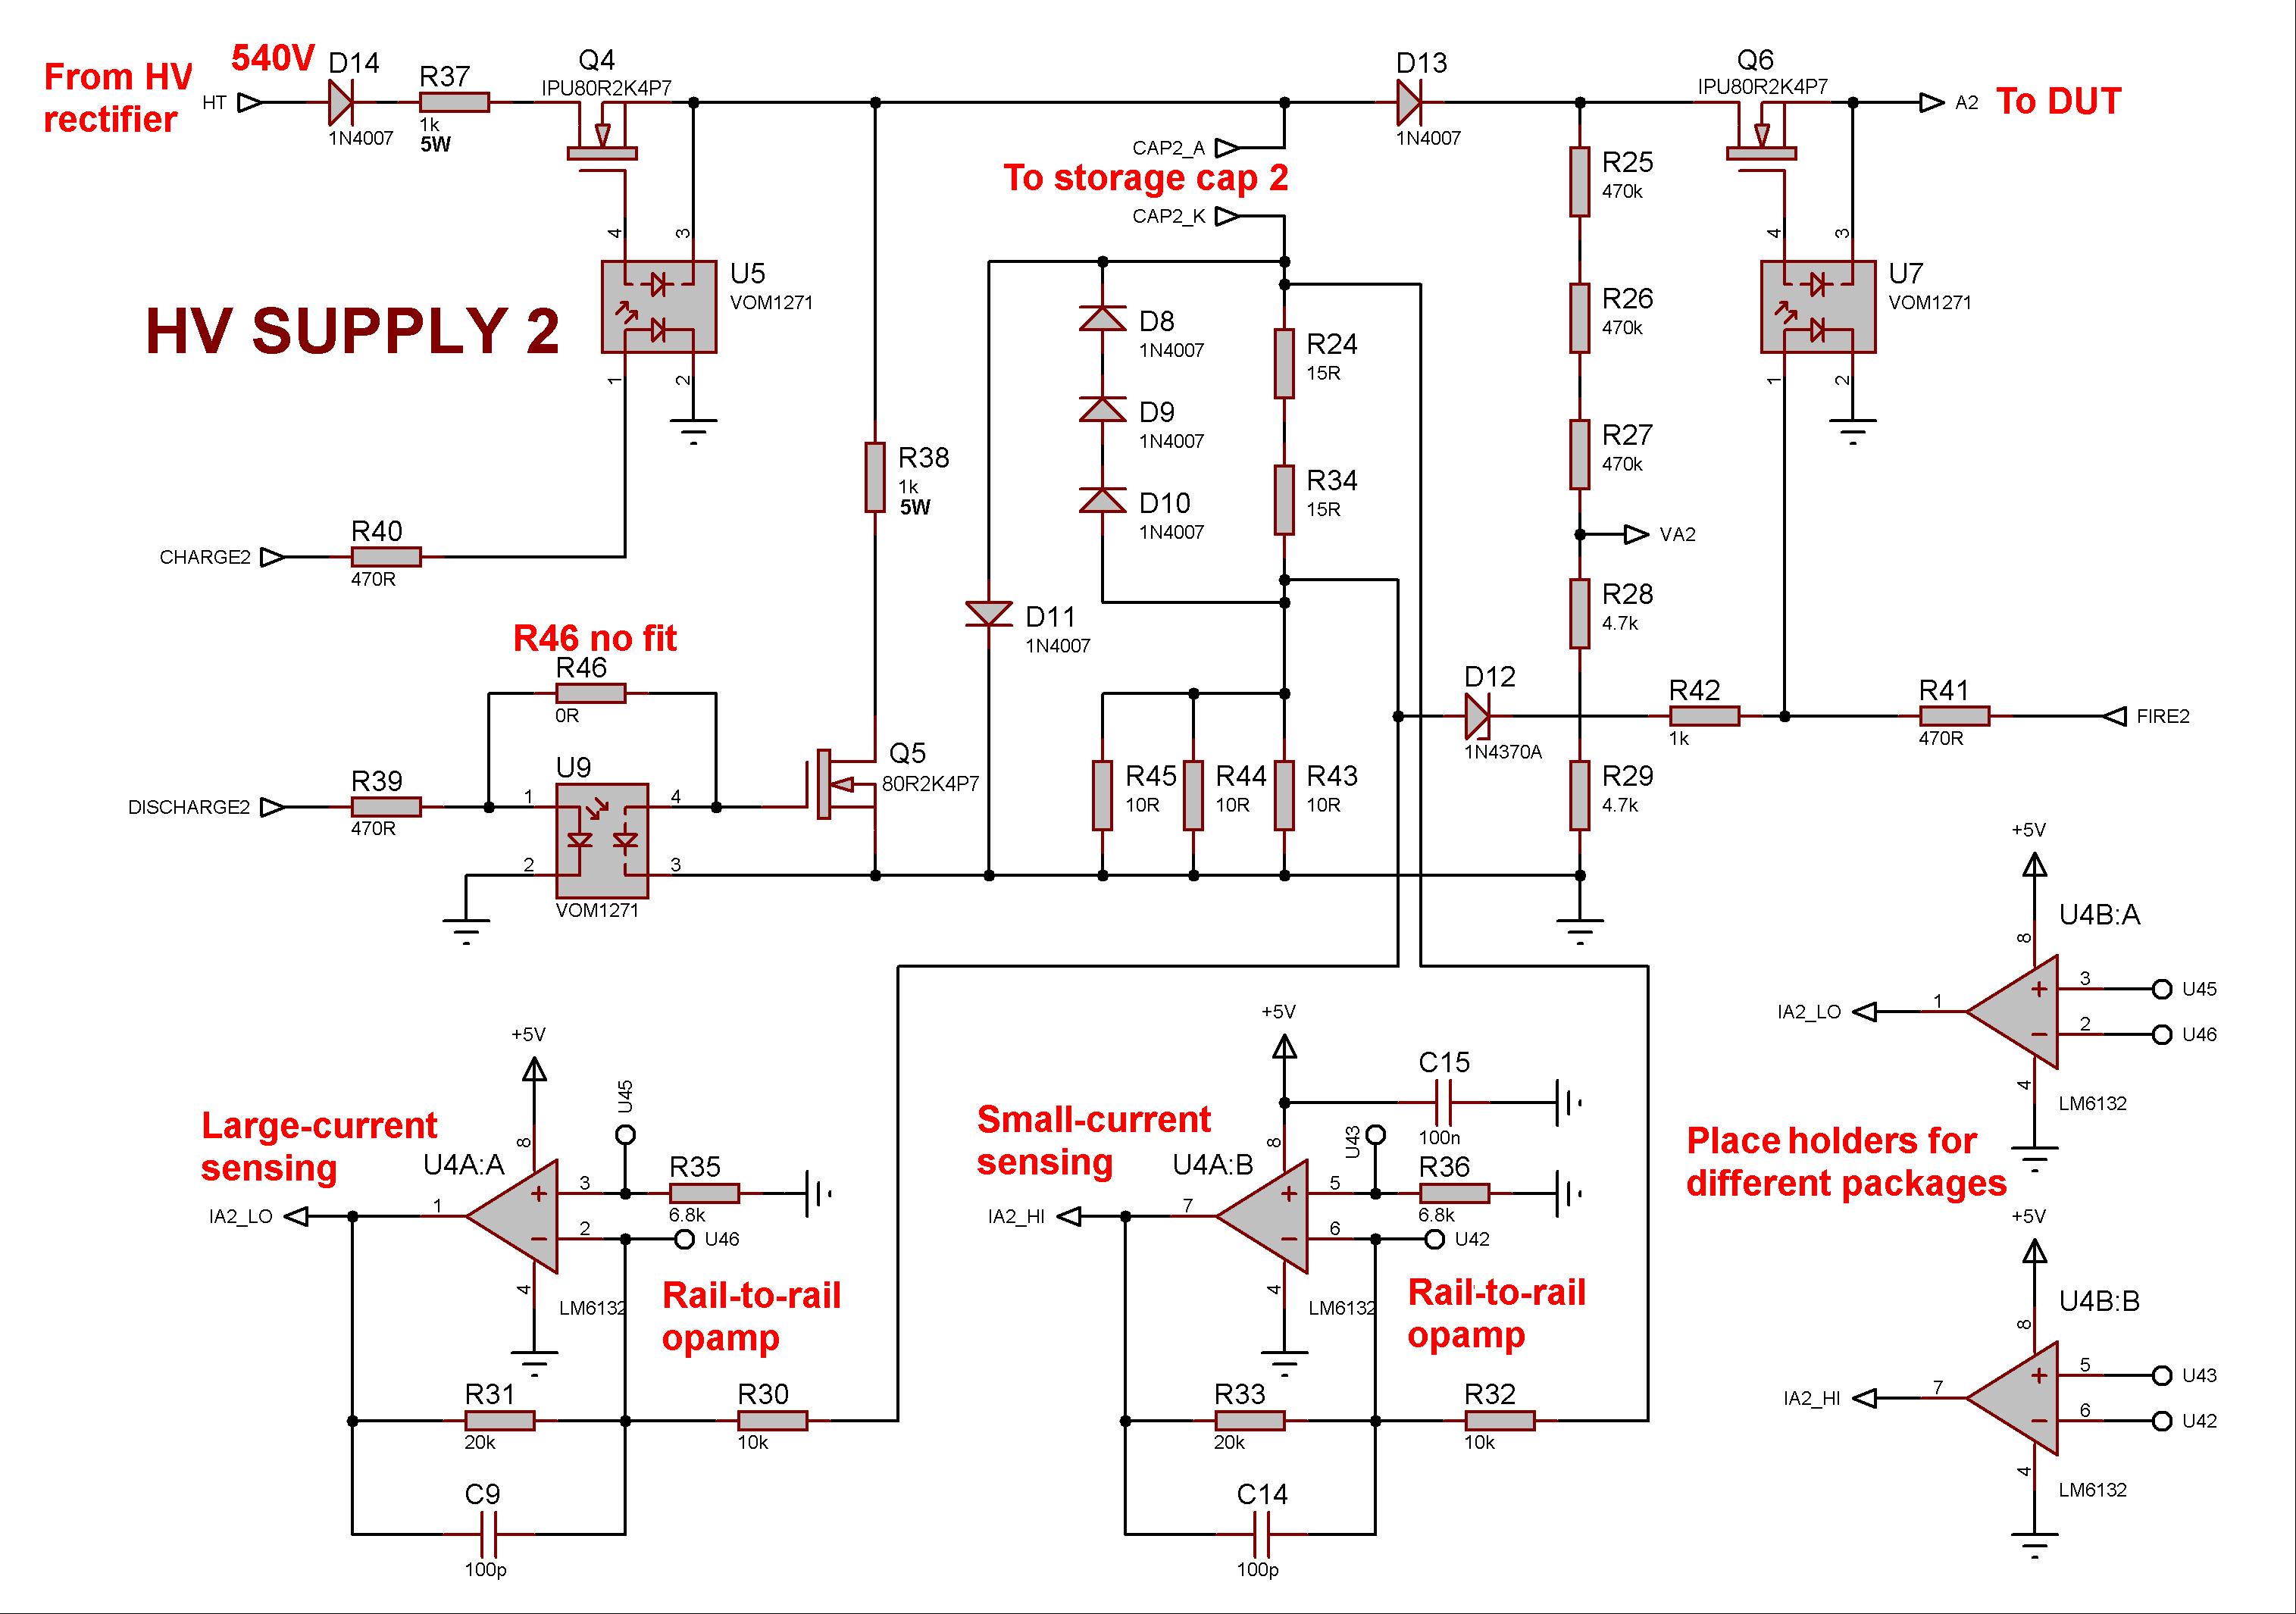
There are two identical high-voltage supplies, each one containing three MOSFETs that are under the control of the master Arduino.
I used used IPU80R2K4P7 MOSFETs but any suitably high voltage MOSFET should work.
I have called these MOSFETs 'charge', 'discharge', and 'fire', so you can probably guess what they do!
These MOSFETs act as switches, being either fully off or fully on at any time; only one MOSFET is on at any given time (per high voltage supply).
Opto-isolators are used to bridge the divide between the wimpy low-voltage digital world and the high-voltage manly world.
The opto-isolators are another 'specialist' components needed for this project; they're not widely stocked but at least they're less than 2 each.
They are called PhotoVoltaic Devices or Drivers (PVDs).
Turning on the LED inside the device causes it to shine light onto some other LEDs which then produce a voltage across themselves.
This voltage is connected between the gate and source of the MOSFET, turning it on or off as required.
R23 & R46 were included to give me the option of controlling the discharge MOSFET directly with the Arduino, but the cost saving is minimal so I recommend using the PVD.
Looking at the top schematic, the 'charge' MOSFET Q1 allows the storage capacitance to be charged up to the required voltage ready for the next measurement.
R12 limits the charging current to a safe level to avoid blowing anything up.
D7 prevents unwanted discharge back through the MOSFET body diode.
The potential divider comprising R7-11 provides the scaled-down voltage which is monitored by the Arduino.
Several resistors are used to improve precision and to share the voltage burden, so ordinary 1% 1/4W devices can be used.
The 'discharge' MOSFET Q2 allows the storage capacitance to be drained again.
R13 limits the discharging current to a safe level.
The bottom high-voltage supply works exactly the same of course; the Arduino controls both simultaneously.
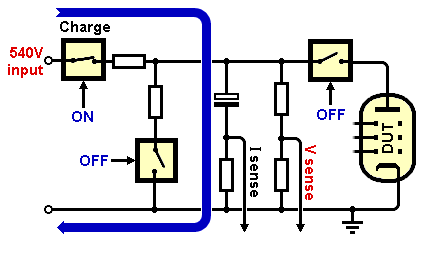 Once the voltages are ready, the 'fire' MOSFET Q3 is turned on, which connects the storage capacitance across the DUT.
Anode current now flows in the DUT from the storage capacitance in a loop, through the current-sense resistance R2-6 which is on the negative side of the capacitance.
This is called 'low-side' sensing.
This is illustrated by the simplified diagram on the right.
Again, several resistors are used for precision and power sharing so 1% 1/4W devices can be used.
The sense resistance is split into two parts (a potential divider) to give me decent resolution at both high-level and low-level currents, since I need to test small bottles and big bottles alike.
Diodes D1-3 allow currents greater than about 60mA to bypass the upper part of the divider to avoid burning out these resistors.
Remember, during the measurement phase the capacitance is discharging through the DUT, so current is flowing 'upwards' through the sense resistance.
Similarly D4 allows the charging current to bypass the sense resistance since we don't care about current flowing in the 'downward' direction.
Once the voltages are ready, the 'fire' MOSFET Q3 is turned on, which connects the storage capacitance across the DUT.
Anode current now flows in the DUT from the storage capacitance in a loop, through the current-sense resistance R2-6 which is on the negative side of the capacitance.
This is called 'low-side' sensing.
This is illustrated by the simplified diagram on the right.
Again, several resistors are used for precision and power sharing so 1% 1/4W devices can be used.
The sense resistance is split into two parts (a potential divider) to give me decent resolution at both high-level and low-level currents, since I need to test small bottles and big bottles alike.
Diodes D1-3 allow currents greater than about 60mA to bypass the upper part of the divider to avoid burning out these resistors.
Remember, during the measurement phase the capacitance is discharging through the DUT, so current is flowing 'upwards' through the sense resistance.
Similarly D4 allows the charging current to bypass the sense resistance since we don't care about current flowing in the 'downward' direction.
Since current flow 'upwards' during the measurement phase, the voltage produced across the sense resistance is negative.
This voltage is therefore inverted (and amplified by x2) by opamps before reaching the Arduino.
Two pairs are shown in the schematic to give me the option of SMD or through-hole opamps.
These are the last 'specialist' components needed for the project, since we need rail-to-rail opamps that can swing their outputs all the way down to ground.
Not all rail-to-rail opamps can do this!
The LM6132 can swing to within about 10mV of ground which is pretty good.
This ultimately means anode currents smaller than [10mV / (2 * 33.3ohms)] = 150uV cannot be accurately measured, and I'm satisfied with that.
In theory, the overall measurement range is 150uV to 60mA with 10-bit precision, i.e. 58uA, and then up to 615mA with 0.6mA precision.
However, it's a good idea to distrust the hardware limits, so I'm quoting the practical range as 200uV to 50mA with 60uA precision, and then up to 500mA with 0.6mA precision.
The Arduino measured both ranges and reports whichever is more accurate.
The theoretical anode voltage measurment range is 0V to 618V with 0.6V precision, but the hardware limit is really 500V with 0.6V precision.
Finally, D5 and R47 form a hardware safety feature (in theory).
If the anode current exceeds about 1A, the 2.4V zener diode should turn on and begin to pull down on the PVD LED (U10), switching it off and therefore disconnecting the DUT, overriding the Arduino control.
However, I haven't fitted the Zener on my prototype so I have not actually tested this.
The Code
 I won't go through the code in detail.
It's pretty basic, anyone who codes should be able to interpret it if they want to: download the Arduino sketch here.
But very quickly, the Arduinos each keep two arrays: target_values[ ] contains the target voltages requested by the user (the array contains slots for the currents too, but the user can't actually request current so they remain empty).
measured_values[ ] contains the actual measured voltages and currents.
The user requests the maximum voltages to sweep up to, the number of datapoints in the sweep, and the number of bias steps.
The Arduino works out the increments in the sweep.
It uses a logarithmic sweep to get better resolution at low anode voltages, which is essential for capturing the pentode 'knee'.
I won't go through the code in detail.
It's pretty basic, anyone who codes should be able to interpret it if they want to: download the Arduino sketch here.
But very quickly, the Arduinos each keep two arrays: target_values[ ] contains the target voltages requested by the user (the array contains slots for the currents too, but the user can't actually request current so they remain empty).
measured_values[ ] contains the actual measured voltages and currents.
The user requests the maximum voltages to sweep up to, the number of datapoints in the sweep, and the number of bias steps.
The Arduino works out the increments in the sweep.
It uses a logarithmic sweep to get better resolution at low anode voltages, which is essential for capturing the pentode 'knee'.
The slave Arduino only controls the buck converter.
As soon as the user inputs the heater voltage, the master sends the valueto the slave which copies it into its target_values[ ] array.
It continuously measures the heater voltage (and current) and tries to make it match the target heater voltage, by adjusting the buck converter PWM.
The slave keeps the heater running all the time, so by the time the user has typed in all the other parameters the valve is usually warmed up and ready to go.
The master Arduino requests the latest heater measurements from the slave during the measurement phase, but I'm not currently using this data for anything since it's fairly low resolution.
The master updates the DACs whenever the target bias voltage/s step from one value to the next in the main testing loop.
It doesn't actually measure the true bias voltage, it just relies on hardware accuracy and assumes it is correct.
The master then charges up the high-voltage capacitor banks.
When both are properly charged it is time to 'fire' and apply the high voltages to the DUT.
The master then records the actual applied voltages and resulting currents as fast as possible (less than a millisecond).
Once it has done this it disconnects the high voltage, prints the result to the serial window, and the process repeats for the next data point until it reaches the maximum requested voltage.
Then it switches to the next bias value, and again sweeps up to the maximum voltage.
When a complete measurement routine has finished and all data reported, it waits for you to tell it to run again or input new paramaters.
Therefore, unlike an oscilliscope-based tracer, the DUT is not being continuously stressed.
Indeed, no heatsinks are needed anywhere in this project.
Using the Analyser
A separate PCB carries three valve sockets: B7G, B9A and octal, with all the pins wired in parallel (all pin-1's connected together, all pin-2's connected together etc), so I can test a wide variety of valves.
There is a small inductor in series with each pin to discourage oscillation.
On the prototype I have the analyser permanently wired up for an EL84, but eventually I will put it into a box and add banana sockets and cables so it can be reconfigured more easily.
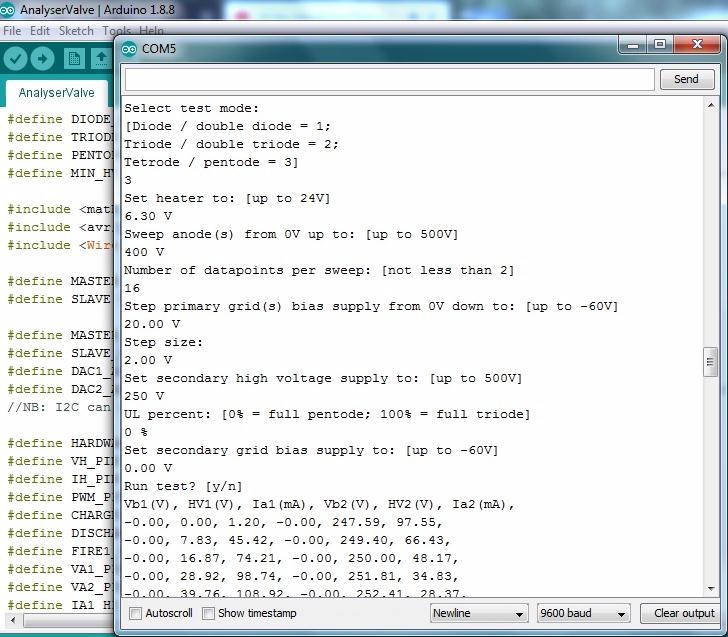
To run a test I open the Arduino IDE and open the Serial Monitor window.
This resets the Arduino, and it will print a series of statements to the monitor.
You type in all the test parameters you want, then it asks if you want to run the test.
During the test all the results are printed to the monitor in a comma-delimited table.
I can then cut and paste the table into notepad, then import that into Excel to plot the curves.
I currently have a template Excel spreadsheet set up for this, but if I want to change the number of data points or something then I have to edit Excel by hand.
It would be cool to have a custom app like John Polstra built, where I can set up the test and have the graph plot automatically.
Unfortunately I am not much of a coder and I don't know how to do that, so I have to do it the long way.
(If anyone wants to collaborate to build an app, do get in touch!)
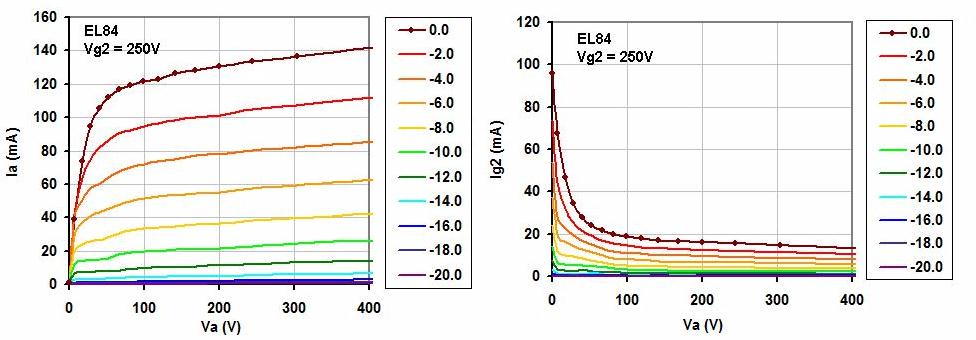
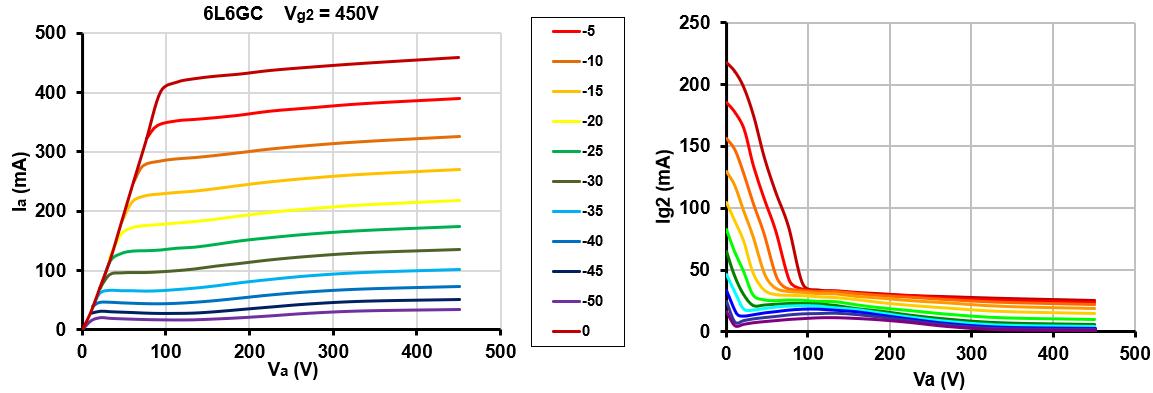
Here are some example curves I made on the analyser.
I currently have a bit of wobble in the traces which I am trying to cure.
I think it has something to do with the way the Arduino does its ADC aquisition.
Update 2022
The analyser met with its first accident.
I plugged in an EL34 and it must have had an internal short because I got visible sparking and the analyser died.
Actually one of the 1k discharge resistors go so hot it melted the solder.
Investigation showed that the 10R current-sense resistors had all burned out on both channels, along with both 'FIRE' MOSFETs, and the 'DISCHARGE' MOSFET on one channel.
Replacing these parts fixed it and it's up and running again now.
I think I will add wire fuses at each of the high-voltage outputs to save the resistors next time...
|